Trump 2.0 stock market underperforms Trump 1.0

BIAS: Center
RELIABILITY: High

Political Bias Rating

This rating indicates the source’s editorial stance on the political spectrum, based on analysis from Media Bias/Fact Check, AllSides, and Ad Fontes Media.

Far Left / Left: Progressive editorial perspective
Lean Left: Slightly progressive tendency
Center: Balanced, minimal editorial slant
Lean Right: Slightly conservative tendency
Right / Far Right: Conservative editorial perspective

Current source: Center. Stories with cross-spectrum coverage receive elevated prominence.

Reliability Rating

This rating measures the source’s factual accuracy, sourcing quality, and journalistic standards based on third-party fact-checking assessments.

Very High: Exceptional accuracy, rigorous sourcing
High: Strong factual reporting, minor issues rare
Mixed: Generally accurate but occasional concerns
Low: Frequent errors or misleading content
Very Low: Unreliable, significant factual issues

Current source: High. Higher reliability sources receive elevated weighting in story prioritization.

Axios
10:10Z

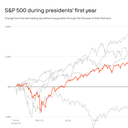
Data: Financial Modeling Prep ; Chart: Axios Visuals U.S. stocks performed worse during the first year of President Trump’s second term than during the same period of his first term. The S&P 500 also underperformed the first year of the Biden and Obama presidencies.

By the numbers: The S&P 500 climbed 15.7% between Trump’s second inauguration day and last Friday, which marked the final trading day of his first year in office. It was up 24.1% during the first year of his prior term, and up 19.3% during Biden’s first year. Obama outperformed them both with a 35.3% gain.

Zoom in: Other indices were kinder to Trump 2.0, at least compared to his Democratic predecessors. The Dow Jones Industrial Average was up 13.5% over the past year, compared to 32.1% for Trump 1.0, 13.3% for Biden, and 58% fo

Continue reading at the original source

Read Full Article at Axios →